
Palo Alto NDP Monitoring
For IPv4 you already have the DHCPv4 “View Allocation” window on the Palo Alto GUI. But for IPv6 addresses that are generated by the nodes themselves via SLAAC, everyone lacks a reporting instance for the MAC-IPv6 bindings. I wrote a few posts about monitoring MAC-IPv6 address bindings a couple of years ago. This feature now makes the traceability of IPv6 nodes available, at least for the local link (layer 2) from the firewall. (Reminder: NDP is link-local only, hence does not traverse any layer 3 routing instance.)
Activation & Tracing
You must only activate the “Enable NDP Monitoring” checkmark within the IPv6 tab for each interface you would like to enable it. You’re done. ;)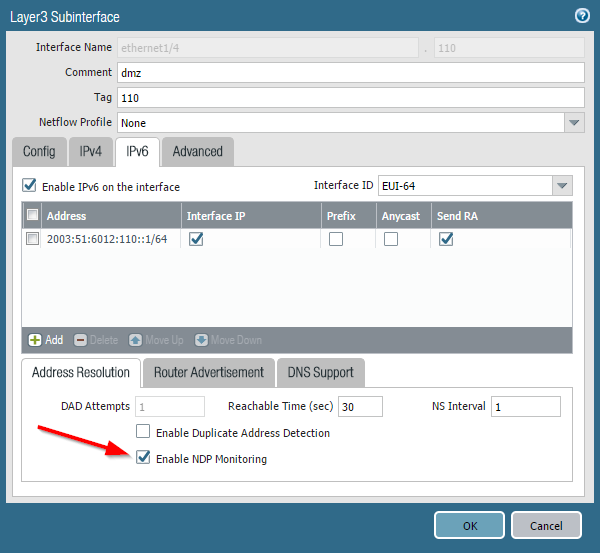
Every new Neighbor Advertisement is now stored along with its MAC address. Palo Alto will also add the User-ID if it’s known for that particular IPv6 address. Note the new clickable symbol in the “Features” column which opens the list. You can also filter the output, e.g., for a MAC address. This is quite useful since a single MAC address can have multiple IPv6 addresses, either because of privacy extensions or because of couple of configured addresses, such as virtual hosts on an F5 load-balancer as in my case:


Neighbor Cache vs. NDP Monitoring
The NDP Monitoring is not that different from the already available neighbor cache, though it uses some other sources. While the “neighbor cache” is an IPv6 standard functionality, this “NDP monitoring” captures neighbor advertisements and duplicate address detection (DAD) messages. Comparing both outputs on the CLI the NDP Monitoring has two more columns: “user id” and “last reported” (while it has a bad column size since the first two columns have no spacing when using subinterfaces). The following listing shows the normal neighbor cache (beginning at line 1), the new NDP monitoring output (line 52) and a filtered version of the NDP monitoring output based on a single MAC address (line 91).|
1
2
3
4
5
6
7
8
9
10
11
12
13
14
15
16
17
18
19
20
21
22
23
24
25
26
27
28
29
30
31
32
33
34
35
36
37
38
39
40
41
42
43
44
45
46
47
48
49
50
51
52
53
54
55
56
57
58
59
60
61
62
63
64
65
66
67
68
69
70
71
72
73
74
75
76
77
78
79
80
81
82
83
84
85
86
87
88
89
90
91
92
93
94
95
96
97
98
99
100
101
102
103
104
105
106
|
weberjoh@pa> show neighbor interface ethernet1/4.110
maximum of entries supported : 500
default base reachable time: 30 seconds
total neighbor entries in table : 39
total neighbor entries shown : 39
interface ip address hw address port status
--------------------------------------------------------------------------------------------
ethernet1/4.110 2003:51:6012:110::12 00:0c:29:f9:31:4e STALE
ethernet1/4.110 2003:51:6012:110::15 00:0c:29:94:13:94 STALE
ethernet1/4.110 2003:51:6012:110::17 00:0c:29:b4:d2:39 STALE
ethernet1/4.110 2003:51:6012:110::19 00:0c:29:86:9a:ba REACHABLE
ethernet1/4.110 2003:51:6012:110::24 00:0c:29:94:13:94 STALE
ethernet1/4.110 2003:51:6012:110::102 00:0c:29:b4:d2:39 STALE
ethernet1/4.110 2003:51:6012:110::6b5:123 b8:27:eb:d1:52:26 REACHABLE
ethernet1/4.110 2003:51:6012:110::a07:53 00:0c:29:c6:51:89 STALE
ethernet1/4.110 2003:51:6012:110::b12:22 00:12:3f:0a:8a:96 REACHABLE
ethernet1/4.110 2003:51:6012:110::b15:22 d4:be:d9:4c:11:9e STALE
ethernet1/4.110 2003:51:6012:110::dcf7:123 b8:27:eb:4f:ff:14 REACHABLE
ethernet1/4.110 2003:51:6012:110::dcfb:123 00:13:95:24:34:04 REACHABLE
ethernet1/4.110 2003:51:6012:110:20c:29ff:fe5b:f073 00:0c:29:5b:f0:73 STALE
ethernet1/4.110 2003:51:6012:110:213:77ff:fe03:53d2 00:13:77:03:53:d2 STALE
ethernet1/4.110 2003:51:6012:110:213:95ff:fe24:3404 00:13:95:24:34:04 STALE
ethernet1/4.110 2003:51:6012:110:28b3:f443:b1ec:b7d6 00:13:77:03:53:d2 STALE
ethernet1/4.110 2003:51:6012:110:4826:7a43:44f3:72a6 00:13:77:03:53:d2 STALE
ethernet1/4.110 2003:51:6012:110:51aa:dc77:7527:bc09 00:13:77:03:53:d2 STALE
ethernet1/4.110 2003:51:6012:110:55f4:f144:62c6:c48a 00:0c:29:f9:31:4e STALE
ethernet1/4.110 2003:51:6012:110:5893:bc3f:b44b:8122 00:13:77:03:53:d2 STALE
ethernet1/4.110 2003:51:6012:110:99fa:d8d8:e7f:d883 00:13:77:03:53:d2 STALE
ethernet1/4.110 2003:51:6012:110:a0c7:81a6:cf9a:48e4 00:0c:29:f9:31:4e STALE
ethernet1/4.110 2003:51:6012:110:a894:6fdd:7169:5149 00:13:77:03:53:d2 STALE
ethernet1/4.110 2003:51:6012:110:b1dc:bada:5bf5:ca54 00:0c:29:b4:d2:39 STALE
ethernet1/4.110 2003:51:6012:110:c2b6:ca25:284f:9033 00:0c:29:b4:d2:39 STALE
ethernet1/4.110 2003:51:6012:110:e995:f904:c293:f36a 00:0c:29:b4:d2:39 DELAY
ethernet1/4.110 fe80::20c:29ff:fe53:63bb 00:0c:29:53:63:bb STALE
ethernet1/4.110 fe80::20c:29ff:fe5b:f073 00:0c:29:5b:f0:73 STALE
ethernet1/4.110 fe80::20c:29ff:fe86:9aba 00:0c:29:86:9a:ba STALE
ethernet1/4.110 fe80::20c:29ff:fe94:1394 00:0c:29:94:13:94 STALE
ethernet1/4.110 fe80::20c:29ff:feb4:d239 00:0c:29:b4:d2:39 STALE
ethernet1/4.110 fe80::20c:29ff:fec6:5189 00:0c:29:c6:51:89 STALE
ethernet1/4.110 fe80::212:3fff:fe0a:8a96 00:12:3f:0a:8a:96 STALE
ethernet1/4.110 fe80::213:77ff:fe03:53d2 00:13:77:03:53:d2 STALE
ethernet1/4.110 fe80::213:95ff:fe24:3404 00:13:95:24:34:04 STALE
ethernet1/4.110 fe80::1d85:ca8f:8ab9:ecba 00:0c:29:f9:31:4e STALE
ethernet1/4.110 fe80::ba27:ebff:fe4f:ff14 b8:27:eb:4f:ff:14 STALE
ethernet1/4.110 fe80::ba27:ebff:fed1:5226 b8:27:eb:d1:52:26 STALE
ethernet1/4.110 fe80::d6be:d9ff:fe4c:119e d4:be:d9:4c:11:9e STALE
weberjoh@pa>
weberjoh@pa>
weberjoh@pa> show neighbor ndp-monitor ethernet1/4.110
maximum of entries supported : 500
total ndp entries in table : 27
total ndp entries shown : 27
ndp entries startat: 1
interface ipv6 address mac user id status last reported
------------------------------------------------------------------------------------------------------------------------
ethernet1/4.1102003:51:6012:110::12 00:0c:29:f9:31:4e unknown STALE 2017/06/25 09:06:34
ethernet1/4.1102003:51:6012:110::15 00:0c:29:94:13:94 unknown STALE 2017/06/26 08:11:50
ethernet1/4.1102003:51:6012:110::17 00:0c:29:b4:d2:39 unknown STALE 2017/06/26 11:54:36
ethernet1/4.1102003:51:6012:110::19 00:0c:29:86:9a:ba unknown DELAY 2017/06/26 12:04:49
ethernet1/4.1102003:51:6012:110::24 00:0c:29:94:13:94 unknown STALE 2017/06/26 06:00:54
ethernet1/4.1102003:51:6012:110::102 00:0c:29:b4:d2:39 unknown STALE 2017/06/23 12:54:15
ethernet1/4.1102003:51:6012:110::6b5:123 b8:27:eb:d1:52:26 unknown REACHABLE 2017/06/26 12:04:23
ethernet1/4.1102003:51:6012:110::a07:53 00:0c:29:c6:51:89 unknown STALE 2017/06/26 12:01:27
ethernet1/4.1102003:51:6012:110::b12:22 00:12:3f:0a:8a:96 unknown REACHABLE 2017/06/26 12:04:31
ethernet1/4.1102003:51:6012:110::b15:22 d4:be:d9:4c:11:9e unknown STALE 2017/06/26 12:04:15
ethernet1/4.1102003:51:6012:110::dcf7:123 b8:27:eb:4f:ff:14 unknown REACHABLE 2017/06/26 12:04:38
ethernet1/4.1102003:51:6012:110::dcfb:123 00:13:95:24:34:04 unknown STALE 2017/06/26 12:04:43
ethernet1/4.1102003:51:6012:110:20c:29ff:fe5b:f073 00:0c:29:5b:f0:73 unknown STALE 2017/06/26 10:58:23
ethernet1/4.1102003:51:6012:110:213:77ff:fe03:53d2 00:13:77:03:53:d2 unknown STALE 2017/06/26 03:07:03
ethernet1/4.1102003:51:6012:110:213:95ff:fe24:3404 00:13:95:24:34:04 unknown STALE 2017/06/26 12:00:35
ethernet1/4.1102003:51:6012:110:28b3:f443:b1ec:b7d6 00:13:77:03:53:d2 unknown STALE 2017/06/25 11:29:59
ethernet1/4.1102003:51:6012:110:4826:7a43:44f3:72a6 00:13:77:03:53:d2 unknown STALE 2017/06/23 18:03:55
ethernet1/4.1102003:51:6012:110:51aa:dc77:7527:bc09 00:13:77:03:53:d2 unknown STALE 2017/06/23 00:07:46
ethernet1/4.1102003:51:6012:110:55f4:f144:62c6:c48a 00:0c:29:f9:31:4e unknown STALE 2017/06/26 11:52:29
ethernet1/4.1102003:51:6012:110:5893:bc3f:b44b:8122 00:13:77:03:53:d2 unknown STALE 2017/06/24 15:41:25
ethernet1/4.1102003:51:6012:110:99fa:d8d8:e7f:d883 00:13:77:03:53:d2 unknown STALE 2017/06/26 09:25:33
ethernet1/4.1102003:51:6012:110:a0c7:81a6:cf9a:48e4 00:0c:29:f9:31:4e unknown STALE 2017/06/24 21:52:46
ethernet1/4.1102003:51:6012:110:b1dc:bada:5bf5:ca54 00:0c:29:b4:d2:39 unknown STALE 2017/06/26 00:19:02
ethernet1/4.1102003:51:6012:110:c2b6:ca25:284f:9033 00:0c:29:b4:d2:39 unknown STALE 2017/06/26 12:03:28
ethernet1/4.1102003:51:6012:110:e995:f904:c293:f36a 00:0c:29:b4:d2:39 unknown REACHABLE 2017/06/26 12:04:41
ethernet1/4.110fe80::20c:29ff:fe5b:f073 00:0c:29:5b:f0:73 unknown STALE 2017/06/22 16:10:56
ethernet1/4.110fe80::213:77ff:fe03:53d2 00:13:77:03:53:d2 unknown STALE 2017/06/24 09:38:15
weberjoh@pa>
weberjoh@pa>
weberjoh@pa> show neighbor ndp-monitor ethernet1/4.110 mac 00:0c:29:b4:d2:39
maximum of entries supported : 500
total ndp entries in table : 27
total ndp entries shown : 5
ndp entries startat: 1
interface ipv6 address mac user id status last reported
------------------------------------------------------------------------------------------------------------------------
ethernet1/4.1102003:51:6012:110::17 00:0c:29:b4:d2:39 unknown STALE 2017/06/26 11:54:36
ethernet1/4.1102003:51:6012:110::102 00:0c:29:b4:d2:39 unknown STALE 2017/06/23 12:54:15
ethernet1/4.1102003:51:6012:110:b1dc:bada:5bf5:ca54 00:0c:29:b4:d2:39 unknown STALE 2017/06/26 00:19:02
ethernet1/4.1102003:51:6012:110:c2b6:ca25:284f:9033 00:0c:29:b4:d2:39 unknown STALE 2017/06/26 12:08:11
ethernet1/4.1102003:51:6012:110:e995:f904:c293:f36a 00:0c:29:b4:d2:39 unknown STALE 2017/06/26 12:05:17
weberjoh@pa>
|
Comments
Post a Comment